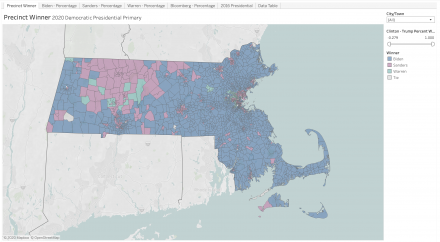
The voting patterns in the 2020 Massachusetts Democratic presidential primary are fascinating. I pulled a download of the precinct-by-precinct data from the Secretary of the Commonwealth’s website. There are filters on each candidate’s totals, so you can see where the relative strengths and weaknesses were. Click on the map to interact with the visualizations, or follow this link. Tabs move between maps, filters help with the analysis.
Please share widely!

Great Map Pablo. Fascinating to compare Biden and Baker percentages. A striking degree of overlap. It seems Gonzales was strongest in the Warren and Bernie parts of the state, and nowhere else. In my view, a minority view around here I know, I do not think this bodes well for a Maura Healey run in 2022 against Charlie Baker or for Ed Markey against Kennedy. We will have to see.